24.6% of US employer businesses used AI in the two weeks to 4 October 2026 (Census Bureau); 20.0% of EU enterprises with 10+ employees did in 2025 (Eurostat). Every figure is sourced.
At a glance
| Key stat | Source | Date |
|---|---|---|
| 24.6% of US employer businesses used AI in a business function in the previous two weeks. | US Census Bureau | Two weeks to 4 Oct 2026 |
| 20.0% of EU enterprises with 10+ employees used at least one AI technology, up from 13.5% in 2024. | Eurostat | 2025 |
| 30% of UK businesses reported using at least one AI technology. | ONS | Sep 2026 |
| EU use rose from 8.1% in 2023 to 20.0% in 2025, partly because the 2025 survey measured more technologies. | Eurostat | 2023-2025 |
| 55.0% of large EU enterprises (250+ employees) used AI, compared with 17.0% of small ones (10-49). | Eurostat | 2025 |
| Denmark had the highest share of EU enterprises using AI (42.0%); Romania had the lowest (5.2%). | Eurostat, Eurostat | 2025 |
| Information and communication was the top sector in the EU, with 62.5% of enterprises using AI. | Eurostat | 2025 |
| 43.6% of US businesses with 250+ employees used AI during the same period. | US Census Bureau | Two weeks to 4 Oct 2026 |
| 34.7% of Lithuanian enterprises with 10+ employees used AI, up from 21.3% in 2025 (national 2026 figure; other countries' 2026 data are not out yet). | Statistics Lithuania | 2026 |
| 48% of Norwegian enterprises with 10+ employees used AI (national figure, series break). | Statistics Norway | 2026 |
| 70.3% of EU enterprises that considered AI but did not use it named lack of expertise as a reason. | Eurostat | 2025 |
| 62% of US organisations with $1bn+ revenue were building, testing, or deploying AI agents. | KPMG | 24 Jul-25 Aug 2026 |
| 95.7% of AI-using US firms reported no AI-driven change in employment over six months. | US Census Bureau | Nov 2025-Feb 2026 |
| Idea Link analysis: the size gap between large and small EU firms widened from 24.1 to 38.0 percentage points, partly because the 2025 survey counted more AI technologies; relative to large firms, small firms' rate rose from 21% to 31%. | Idea Link analysis of Eurostat data | 2023-2025 |
In the two weeks to 4 October 2026, 24.6% of US employer businesses used AI, according to the US Census Bureau. In 2025, the share was 20.0% of EU enterprises with 10 or more employees, according to Eurostat. The UK reported a higher figure: 30% in September 2026, according to the ONS. Those AI adoption statistics don’t measure the same thing. The result depends on which businesses were counted and what each survey calls AI use. This page compares primary sources, lays out the differences, and links to a CSV of every figure. Every figure was checked against its source on 29 October 2026.
Last updated: 29 October 2026. Next update: after the US Census Bureau's next biweekly release (5 November 2026) and Eurostat's 2026 enterprise release (15 December 2026).
How many businesses use AI?
Official statistics put business AI use at around one in five to three in ten firms, with higher rates among larger firms. Surveys of large companies, or statistics weighted by workers rather than firms, often report bigger shares. Both sets of statistics can be accurate. They answer different questions.
Three choices drive the difference: which businesses count (firms with 10 or more employees, all employers, executives, or workers), what the survey defines as using artificial intelligence, and how it weights the results. Change any of those, and adoption rates can move by tens of percentage points. Read these AI adoption statistics with the definitions beside them.
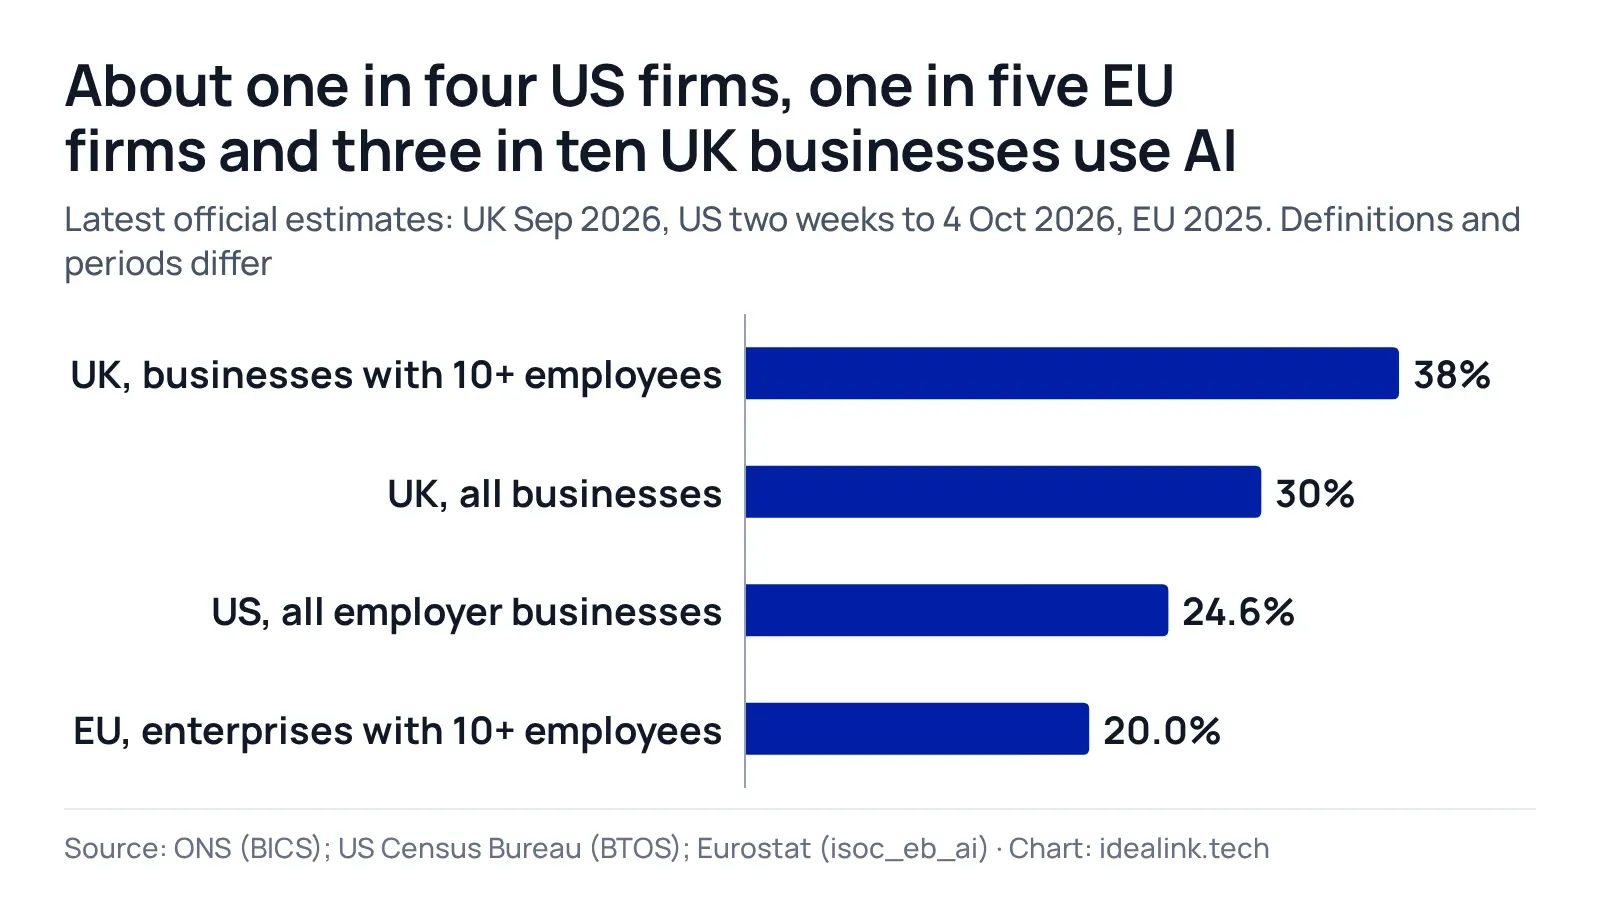
| Measure | Share | Period |
|---|---|---|
| UK, businesses with 10+ employees | 38% | September 2026 |
| UK, all businesses | 30% | September 2026 |
| US, all employer businesses | 24.6% | Two weeks to 4 October 2026 |
| EU, enterprises with 10+ employees | 20.0% | 2025 |
Source: ONS, US Census Bureau, Eurostat. Chart and table: Idea Link. Definitions and periods differ; the next table shows who each figure counts.
| Measure | Share | Who is counted | Source |
|---|---|---|---|
| Eurostat enterprise survey | 20.0% | EU27 enterprises with 10+ employees (excluding finance) using at least one of eight AI technologies, 2025 | Eurostat |
| OECD aggregate | 20.3% | Businesses with 10+ employees in the OECD members that report, 2025 (mostly European; no US or UK data) | OECD |
| US Census BTOS | 24.6% | US employer businesses (excluding farms) using AI in any business function in the last two weeks, to 4 Oct 2026 | US Census Bureau |
| US Census AI supplement, firm-weighted | 17.9% | Same population, six biweekly panels pooled, 17 Nov 2025-8 Feb 2026 | US Census Bureau |
| US Census AI supplement, employment-weighted (CES working paper) | 32% | Firms weighted by their employment, Nov 2025-Jan 2026 | US Census Bureau CES |
| ONS BICS | 30% | UK businesses of all sizes, weighted by count, Sep 2026 | ONS |
| Atlanta Fed Survey of Business Uncertainty | 78% | Share of the US labor force working at firms that have adopted AI (employment-weighted), Nov 2025 | Federal Reserve Board |
| Firm Data on AI (NBER) | 78% | Firms in seven countries, as reported by nearly 9,000 senior executives, summer 2026 | NBER |
| EIB Investment Survey | 37% | EU firms with 5+ employees using generative AI (not all AI), Apr-Jul 2025 | European Investment Bank |
The two kinds of roundup can both be right. One measures the share of workers employed at firms that adopted AI; another measures the share of firms that use it. They are different statistics about different units. Mixing them up gives the wrong answer.
What is the AI adoption rate in 2026?
The US Census Bureau publishes a new reading every two weeks, so its latest rate runs through early October 2026. The EU’s latest official rate is from 2025, while the UK’s is from September 2026. Their definitions differ, so the rates don’t line up directly. Eurostat’s 2026 release is due in December.
The US Census Bureau’s Business Trends and Outlook Survey (BTOS) has two AI series. From September 2023 through September 2025, it asked whether businesses used AI “in producing goods or services.” In November 2025, the wording changed to AI “in any of its business functions.” The reported share rose when the question broadened. Those two series cannot be joined into one trend line.
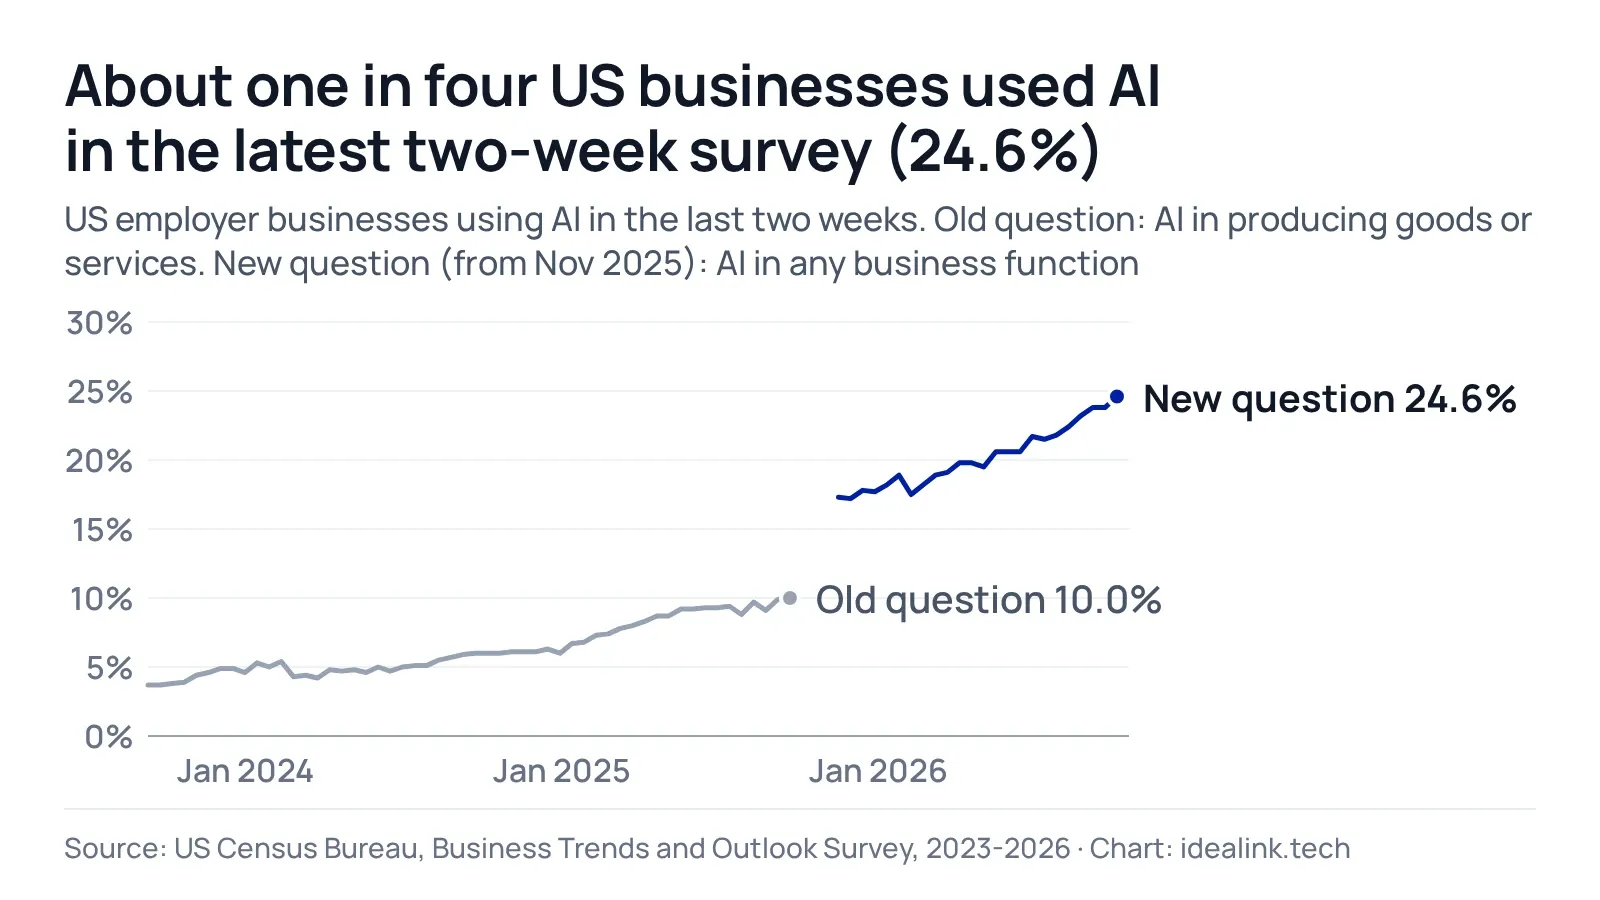
| Reading (reference period) | Question | Share of US employer businesses (%) |
|---|---|---|
| First reading (28 Aug-10 Sep 2023) | Old: AI "in producing goods or services" | 3.7 |
| Last reading on the old question (8-21 Sep 2025) | Old: AI "in producing goods or services" | 10.0 |
| First reading on the new question (3-16 Nov 2025) | New: AI "in any of its business functions" | 17.3 |
| Latest reading (21 Sep-4 Oct 2026) | New: AI "in any of its business functions" | 24.6 |
| Expected use in the next six months (latest reading) | New: AI "in any of its business functions" | 28.6 |
Source: US Census Bureau, BTOS national estimates and AI core questions (old wording), 2023-2026. Chart and table: Idea Link.
Since 22 October 2026, the Census Bureau has published these questions under the label “Super Intelligence or SI (formerly referred to as Artificial Intelligence or AI),” following Executive Order 14434 (Census Bureau, About the data). The latest reading above used the old AI wording. The 5 November 2026 release, based on responses collected from 19 October to 1 November, is the first to use the updated wording (Census Bureau). This page still calls it AI because that is what the data in these figures measures.
The EU’s 2025 rate followed 13.5% in 2024 (Eurostat). Here’s the full trend:
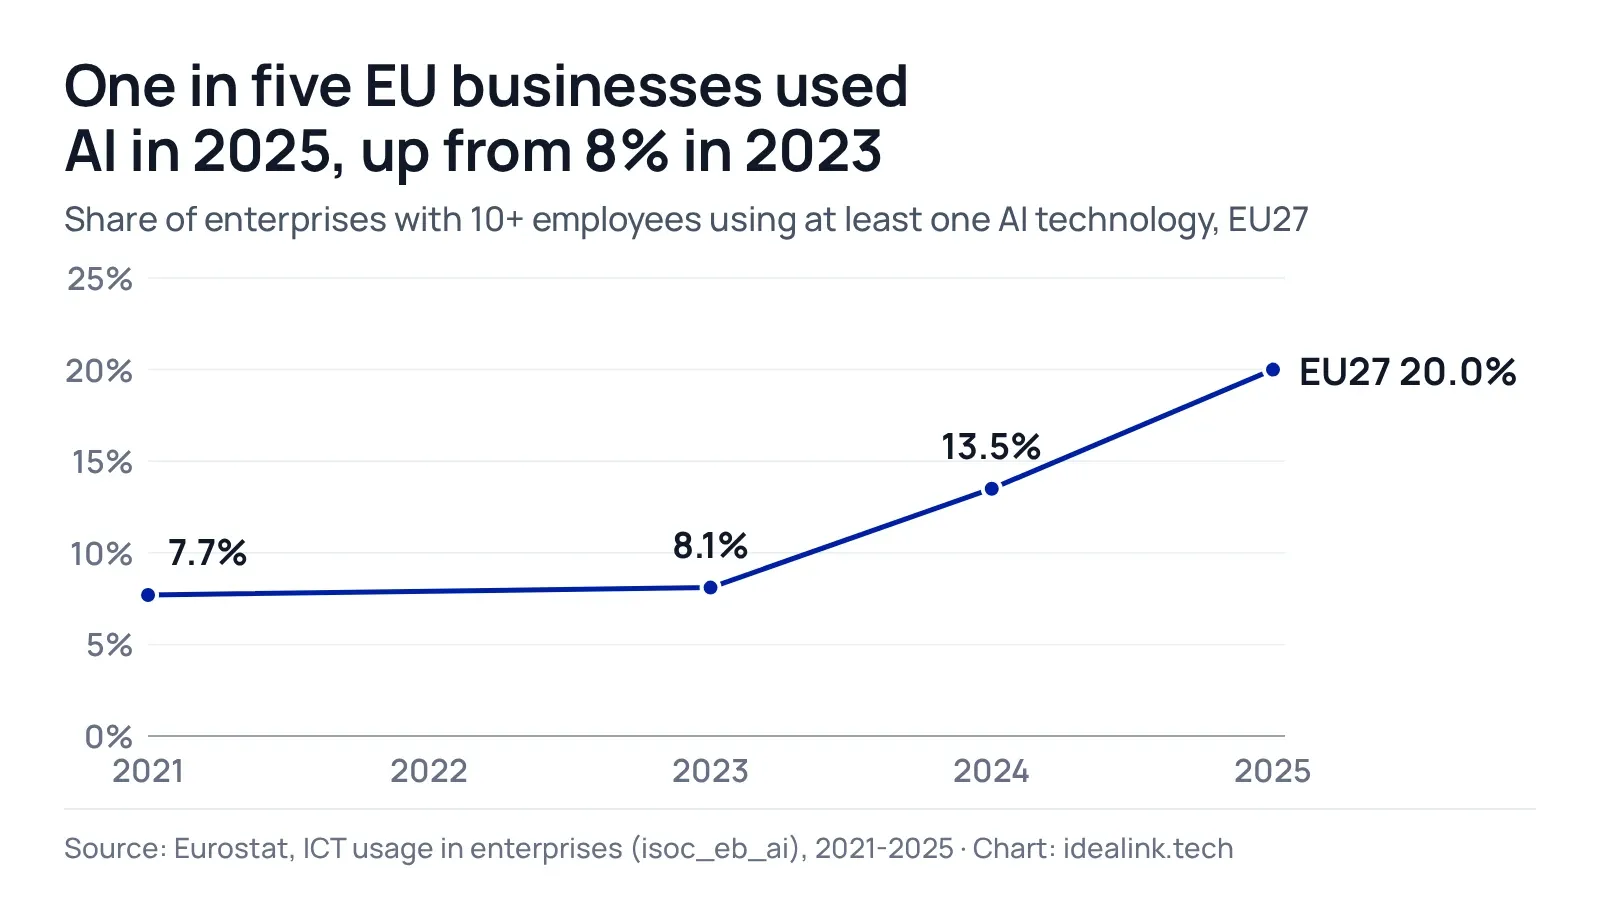
| Year | Share of EU enterprises (%) |
|---|---|
| 2021 | 7.7 |
| 2023 | 8.1 |
| 2024 | 13.5 |
| 2025 | 20.0 |
Source: Eurostat, ICT usage in enterprises (isoc_eb_ai), 2021-2025. Chart and table: Idea Link.
Some of the jump from 2024 to 2025 comes from a survey change, not a sudden change in business behavior. The 2025 questionnaire added a technology type for generating pictures, video, or sound, and expanded “generating written or spoken language” to include programming code. The years aren’t directly comparable (Eurostat). The 2021 and 2023 statistics used the earlier list of seven artificial intelligence technologies. There was no AI module in 2022.
Two national statistics offices have published 2026 figures ahead of Eurostat. Statistics Lithuania reports that 34.7% of enterprises used AI in 2026, up from 21.3% in 2025. Statistics Norway reports that 48% of enterprises with 10 or more employees used AI in 2026, compared with about three in ten in 2025. These are national 2026 statistics, not same-year comparisons with Eurostat’s 2025 data. Norway’s 2026 series has a break because it uses a new industry classification. Lithuania’s 2026 figure probably has one too: its by-industry series ends in 2025.
In the UK, ONS counts businesses of every size that used at least one artificial intelligence technology. Its September 2026 share, shown at the top of this page, is up from 9% when the question first appeared in September 2023. For businesses with 10 or more employees, the closest match to Eurostat’s population, the figure was 38%.
The EU has a higher target. The legal Digital Decade target calls for at least 75% of EU enterprises to take up cloud computing, big data, or AI by 2030 (Decision (EU) 2022/2481). The Commission also tracks AI on its own against that same level. On current trends, it projects 54.28% by 2030, with the target not reached before 2035.
How does AI adoption differ by company size?
Across every dataset we checked, large firms use AI more often than small firms, in both the US and the EU.
In the US, use ranges from about a quarter of the smallest firms to a clear lead among businesses with 250 or more employees, according to the US Census Bureau:
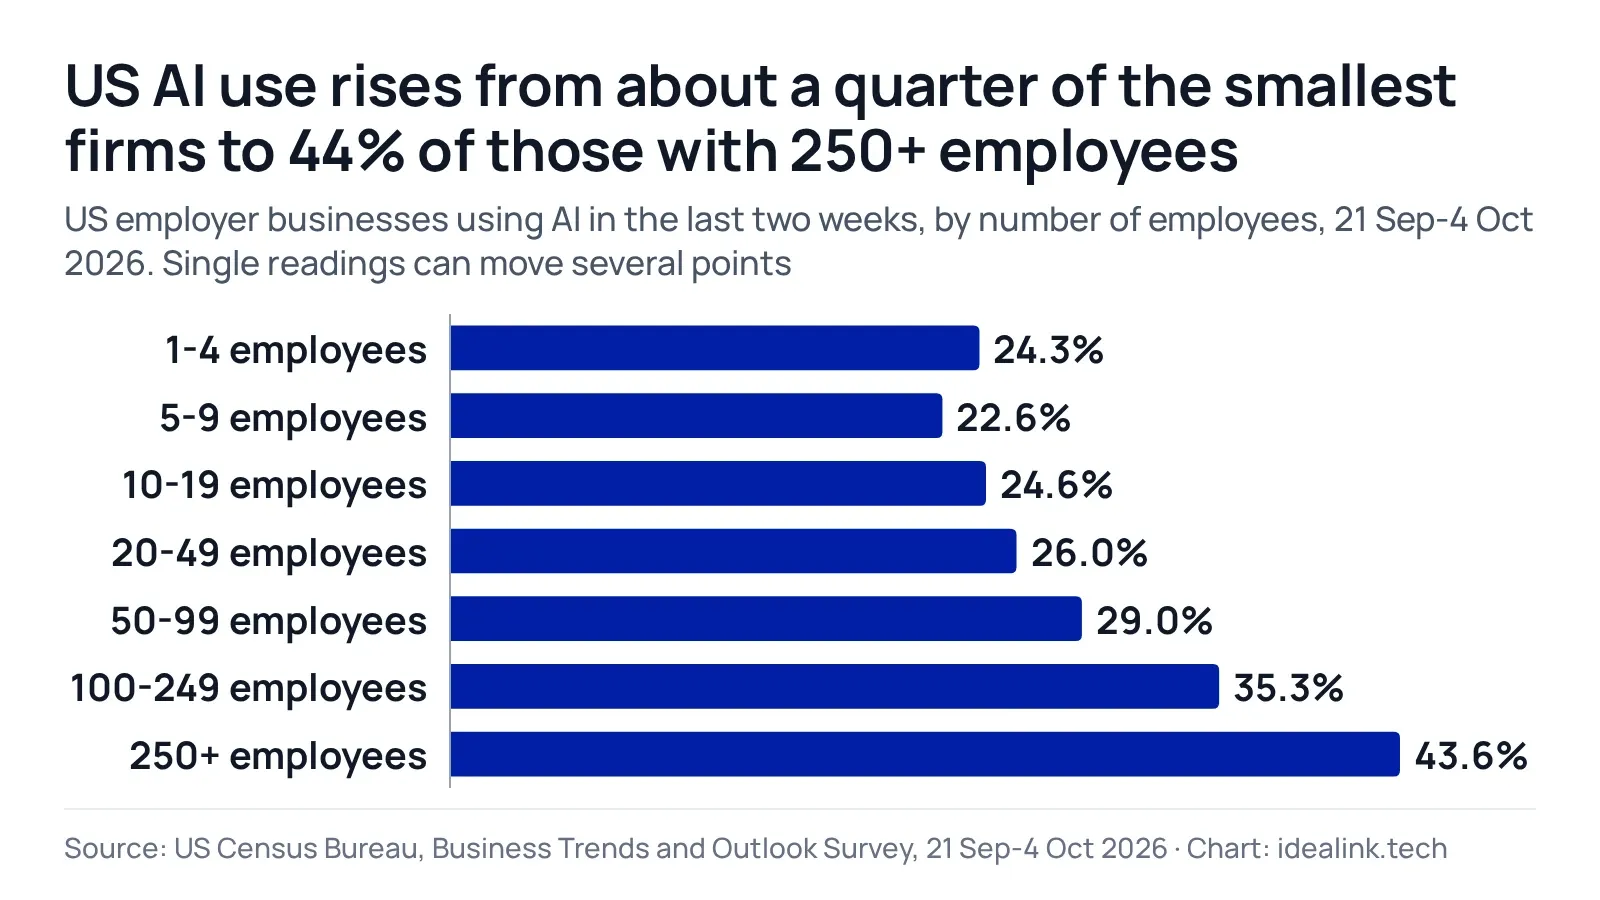
| Employees | Share of US employer businesses (%) |
|---|---|
| 1-4 | 24.3 |
| 5-9 | 22.6 |
| 10-19 | 24.6 |
| 20-49 | 26.0 |
| 50-99 | 29.0 |
| 100-249 | 35.3 |
| 250+ | 43.6 |
Source: US Census Bureau, BTOS employment size class estimates, 21 Sep-4 Oct 2026. Chart and table: Idea Link.
The estimate for businesses with 250 or more employees moves quite a bit between readings: it was 36.5% in the previous two-week period (US Census Bureau). The pattern isn’t perfectly smooth either. Firms with 1-4 employees report slightly higher use than those with 5-9.
In the EU, large enterprises use AI at more than three times the rate of small ones (Eurostat):
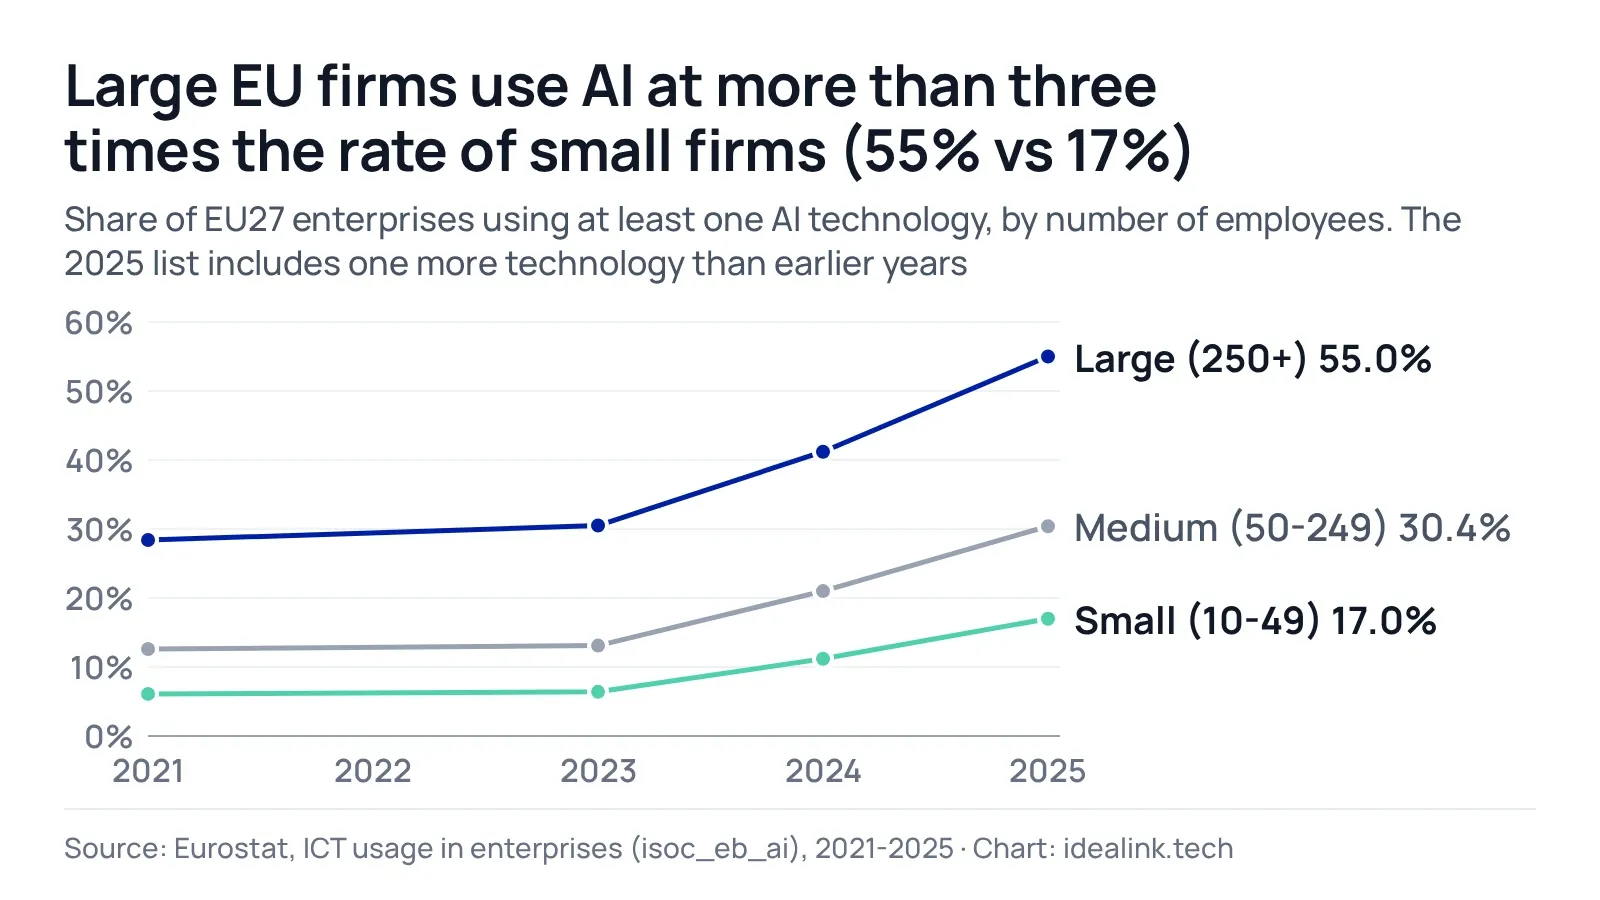
| Year | Small (10-49) (%) | Medium (50-249) (%) | Large (250+) (%) |
|---|---|---|---|
| 2021 | 6.1 | 12.6 | 28.4 |
| 2023 | 6.4 | 13.1 | 30.5 |
| 2024 | 11.2 | 21.0 | 41.2 |
| 2025 | 17.0 | 30.4 | 55.0 |
Source: Eurostat, ICT usage in enterprises (isoc_eb_ai), 2021-2025. Chart and table: Idea Link.
Other sources find the same pattern, though they sort company size into different groups. Each figure below uses its source’s own categories:
- OECD aggregate, 2025: 52.1% of businesses with 250+ employees used AI, compared with 17.5% of those with 10-49.
- US Census AI supplement, Nov 2025-Jan 2026: 31% of firms with 250+ employees, compared with 18% of those with 1-4 employees. The smallest US group doesn’t match Eurostat’s 10-49 category.
- UK ONS, September 2026: 51% of businesses with 250+ employees used AI, compared with 29% of those with fewer than 10.
- EIB, generative AI only, 2025: 44% of large EU firms used generative AI, compared with 28% of SMEs (5-249 employees).
- ECB SAFE survey, euro area, late 2025: 35% of SMEs did not use AI, compared with 13% of large firms.
- Eurobarometer, spring 2026: 41% of firms with fewer than 10 employees used AI or algorithmic management, rising to 64% of firms with 250-749 employees. This broader definition includes limited or experimental use and automated systems that aren’t AI. It also covers heads of SMEs and mid-caps, so these statistics shouldn’t be compared with Eurostat’s figures.
Which countries use AI the most?
Comparable official country rankings are mostly available for Europe, where Eurostat covers the EU and Norway. The US and UK figures are in the sections above. The OECD has older, less comparable figures for other countries, listed below.
Within the EU, Denmark, Finland, and Sweden lead in AI adoption. Romania, Poland, and Bulgaria sit at the bottom. In 2025, Denmark reached 42.0%, Finland 37.8%, and Sweden 35.0%. Romania stood at 5.2% and Poland at 8.4%, with Bulgaria just above Poland.
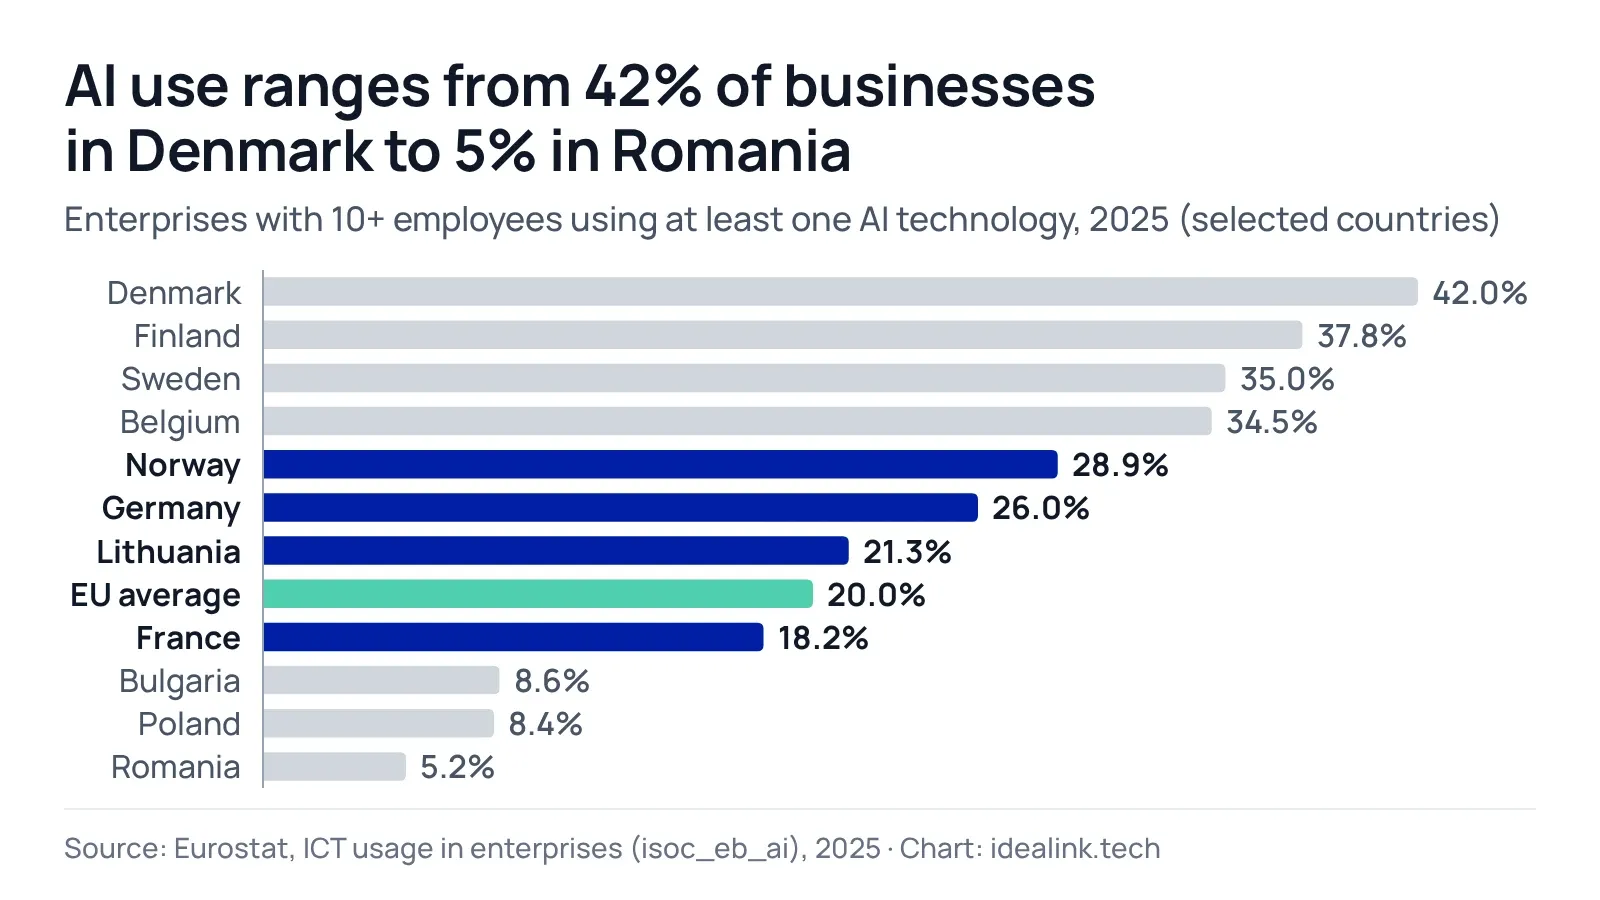
| Country | Share of enterprises (%) |
|---|---|
| Denmark | 42.0 |
| Finland | 37.8 |
| Sweden | 35.0 |
| Belgium | 34.5 |
| Norway | 28.9 |
| Germany | 26.0 |
| Lithuania | 21.3 |
| EU average | 20.0 |
| France | 18.2 |
| Bulgaria | 8.6 |
| Poland | 8.4 |
| Romania | 5.2 |
Source: Eurostat, ICT usage in enterprises (isoc_eb_ai), 2025. Chart and table: Idea Link.
The full ranking includes all 27 EU member states and Norway, with the EU average shown for comparison:
| Rank | Country | Share of enterprises using AI, 2025 (%) |
|---|---|---|
| 1 | Denmark | 42.0 |
| 2 | Finland | 37.8 |
| 3 | Sweden | 35.0 |
| 4 | Belgium | 34.5 |
| 5 | Luxembourg | 33.6 |
| 6 | Netherlands | 33.2 |
| 7 | Austria | 30.0 |
| 8 | Norway | 28.9 |
| 9 | Germany | 26.0 |
| 10 | Estonia | 23.4 |
| 11 | Slovenia | 21.6 |
| 12 | Malta | 21.5 |
| 13 | Lithuania | 21.3 |
| 14 | Spain | 20.3 |
| 15 | Ireland | 19.6 |
| 16 | France | 18.2 |
| 17 | Slovakia | 18.0 |
| 18 | Czechia | 17.6 |
| 19 | Italy | 16.4 |
| 20 | Croatia | 15.2 |
| 21 | Latvia | 12.2 |
| 22 | Portugal | 11.5 |
| 23 | Hungary | 10.4 |
| 24 | Cyprus | 9.3 |
| 25 | Greece | 8.9 |
| 26 | Bulgaria | 8.6 |
| 27 | Poland | 8.4 |
| 28 | Romania | 5.2 |
| - | EU average | 20.0 |
Source: Eurostat, ICT usage in enterprises (isoc_eb_ai), 2025, enterprises with 10+ employees, rounded from Eurostat's two-decimal values (Eurostat's news release rounds Bulgaria's 8.55% to 8.5%). Ranking: Idea Link analysis of Eurostat data.
Lithuania. Idea Link’s analysis of Eurostat data puts Lithuania 13th of 28 for AI use, 1.4 points above the EU average (21.30% against 19.95%), and 3rd for growth from 2024 to 2025. The increase took the country from below the EU average to above it. Statistics Lithuania’s 2026 national figure above comes from a later year and a different survey release, so it isn’t part of this ranking. A different kind of data comes from OpenAI: 85% of Lithuanian firms’ ChatGPT output in September 2026 was agentic, the highest in the EU. That figure covers usage among ChatGPT business customers, not adoption across businesses.
Norway. Norway ranks 8th of 28 for AI use, 8.9 points above the EU average, and 13th of 28 for growth from 2024 to 2025 (+8.1 points). Eurostat includes Norway as an EEA country. Statistics Norway’s 2026 figure above uses a new industry classification, so it can’t be compared with the 2025 row.
France. France ranks 16th of 28, 1.8 points below the EU average, and 11th of 28 for growth (+8.3 points). INSEE reports that 18% of French enterprises with 10 or more employees used AI in 2025, three times the 2023 rate. The figure matches Eurostat’s statistics. In OpenAI’s usage data, 55% of the ChatGPT output of French business customers was agentic in September 2026.
Germany. Germany ranks 9th of 28, 6.0 points above the EU average, and 16th of 28 for growth (+6.2 points). Destatis reports that 26% of enterprises with 10 or more employees used AI: 23% of small firms, 36% of medium firms, and 57% of large firms. In OpenAI’s usage data, 51% of the ChatGPT output of German business customers was agentic in September 2026.
Outside Europe, the OECD business ICT database asks a question similar to Eurostat’s, but its country figures come from different years. It puts Korea at 32.9% in 2024, Canada at 8.3% in 2023, and Japan at 9.2% in 2023. Japan’s definition differs from the EU standard. The OECD flags Korea’s increase from 2.7% in 2021 to 28.0% in 2022 as a break in the series. None of these figures is from 2025.
Microsoft’s AI Diffusion Report counts people, not businesses. It estimates the share of the working-age population (15-64) using a generative AI product, based on telemetry. In Q2 2026, the figures were 25.1% in Lithuania, 49.4% in Norway, 49.6% in France, 32.3% in Germany, and 18.8% worldwide. France ranks above Germany in this report and below it in Eurostat’s table. Individual use of AI and business adoption are different measures.
Among OpenAI's own business customers (ChatGPT Enterprise and Business accounts), the top 10% by output tokens per active user are what OpenAI calls frontier firms; about 65% of them were in North America and about 10% in the EU in September 2026. This is a breakdown of one vendor's heaviest customers, not a country-by-country measure of adoption.
Which industries use AI the most?
Information and communication leads AI adoption by industry in the US, the EU, and the UK.
In the US, the Information sector had the highest share of any sector in the two weeks to 4 October 2026. Professional and technical services and finance and insurance followed:
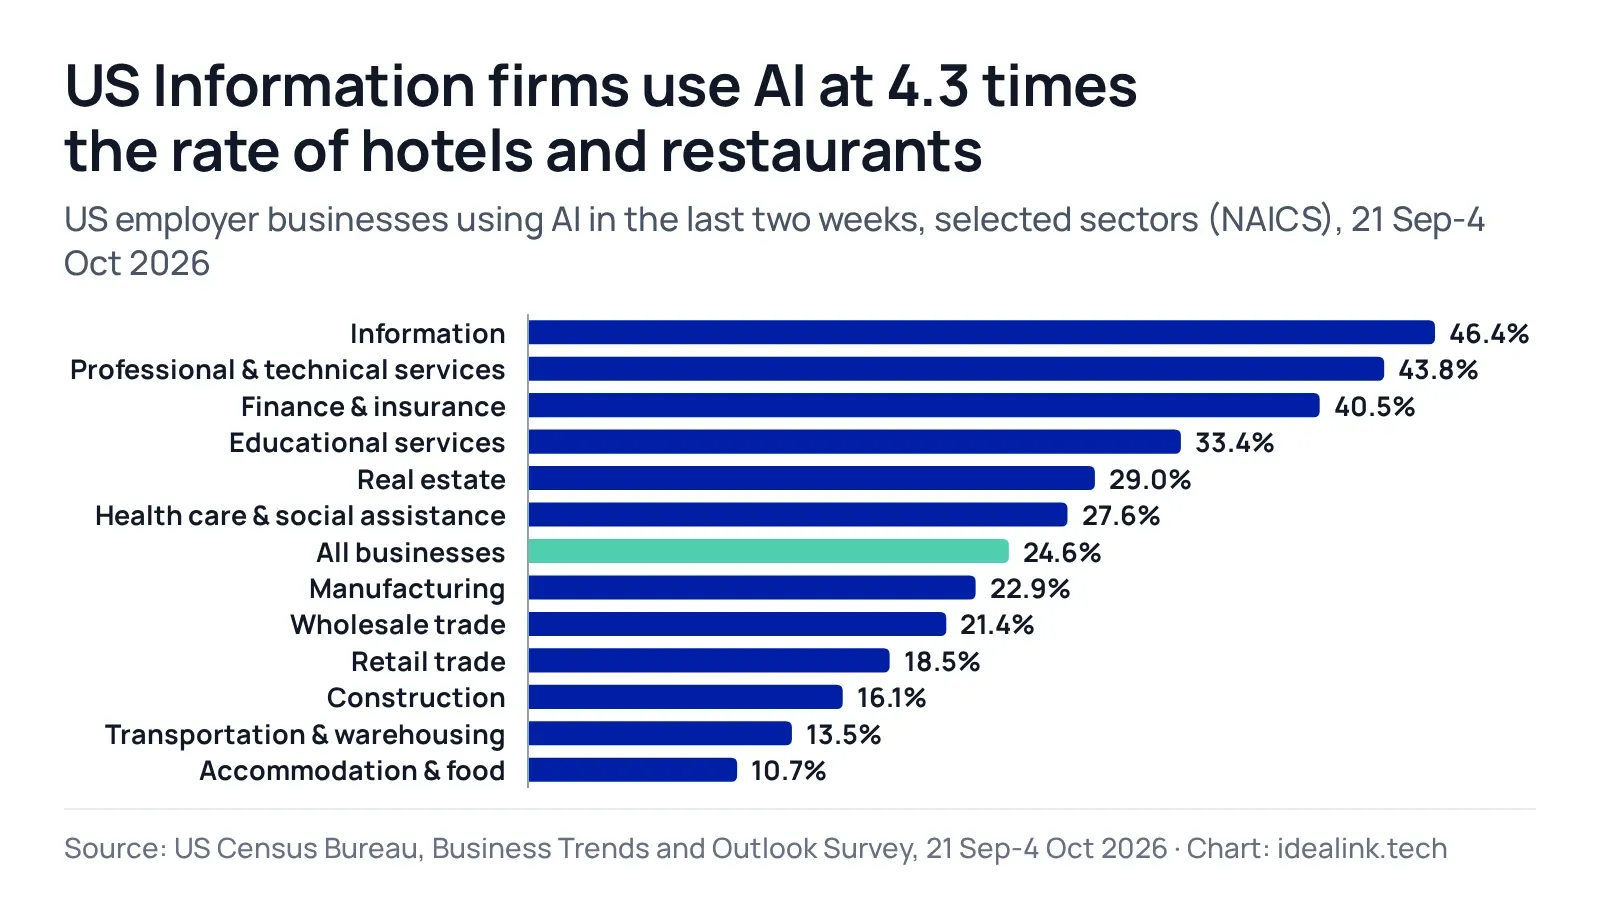
| Sector | Share of US employer businesses (%) |
|---|---|
| Information | 46.4 |
| Professional & technical services | 43.8 |
| Finance & insurance | 40.5 |
| Educational services | 33.4 |
| Real estate | 29.0 |
| Health care & social assistance | 27.6 |
| All businesses | 24.6 |
| Manufacturing | 22.9 |
| Wholesale trade | 21.4 |
| Retail trade | 18.5 |
| Construction | 16.1 |
| Transportation & warehousing | 13.5 |
| Accommodation & food | 10.7 |
Source: US Census Bureau, BTOS sector estimates, 21 Sep-4 Oct 2026, 12 of 19 NAICS sectors (not shown: agriculture, mining, utilities, management of companies, administrative and support services, arts and recreation, other services, and multi-sector companies). Chart and table: Idea Link.
In the EU, the sector reached 62.5% of enterprises in 2025. Construction had the lowest share.
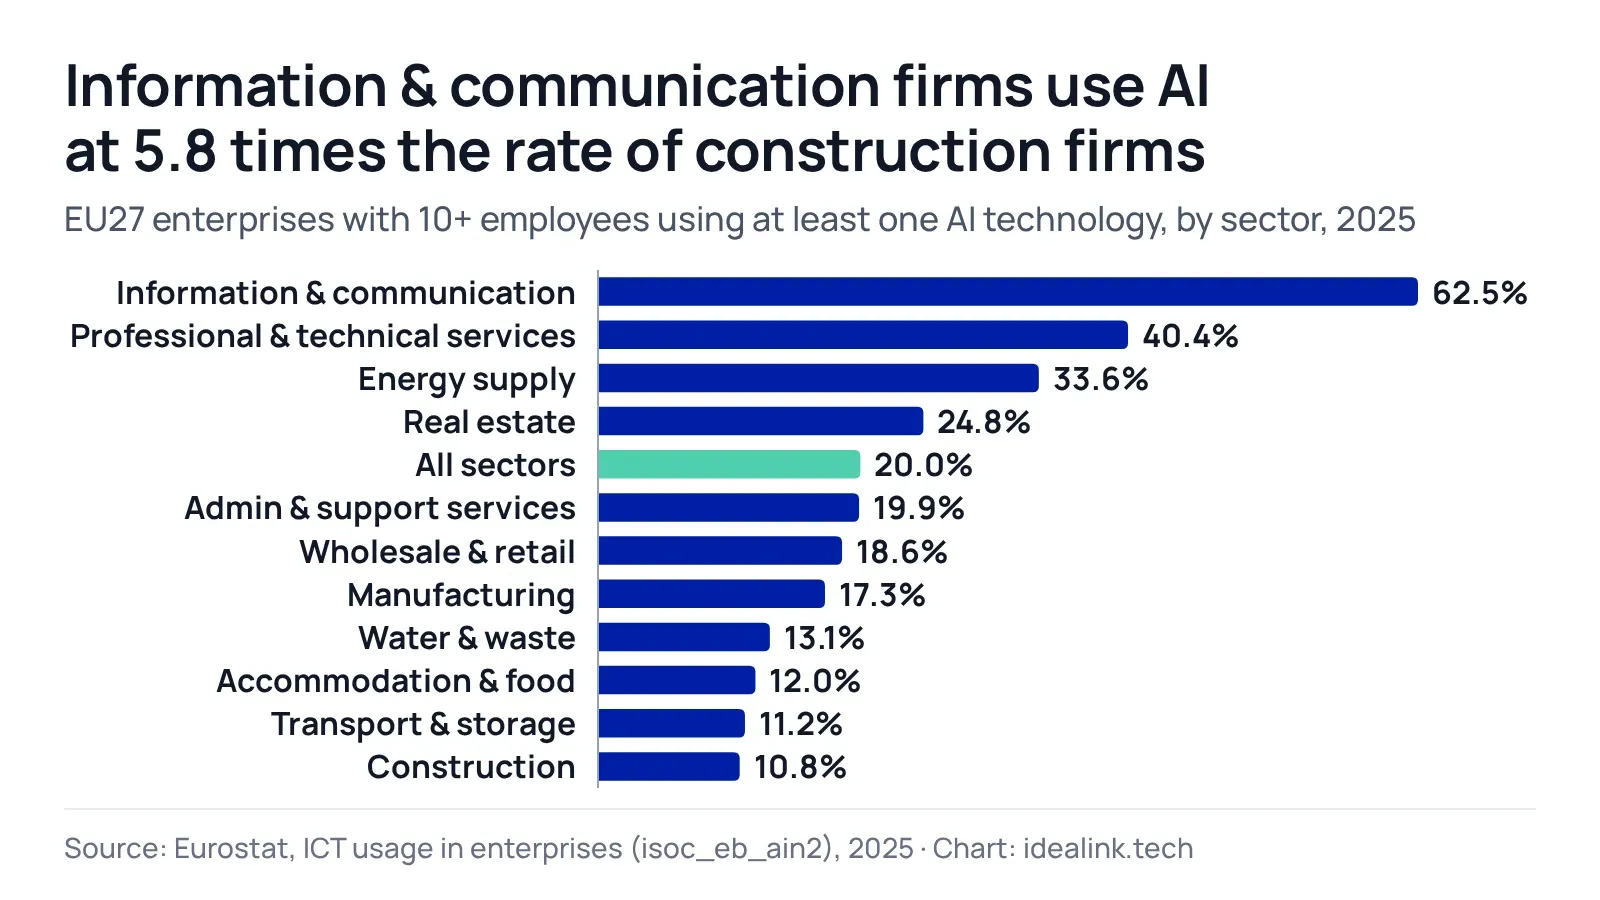
| Sector | Share of enterprises (%) |
|---|---|
| Information & communication | 62.5 |
| Professional & technical services | 40.4 |
| Energy supply | 33.6 |
| Real estate | 24.8 |
| All sectors | 20.0 |
| Admin & support services | 19.9 |
| Wholesale & retail | 18.6 |
| Manufacturing | 17.3 |
| Water & waste | 13.1 |
| Accommodation & food | 12.0 |
| Transport & storage | 11.2 |
| Construction | 10.8 |
Source: Eurostat, ICT usage in enterprises (isoc_eb_ain2), 2025. Chart and table: Idea Link.
In the UK, around 60% of information and communication businesses reported using an AI technology in September 2026, the highest result among industries surveyed.
What do businesses use AI for?
Among EU enterprises that use AI, marketing and sales lead, followed by business administration (Eurostat).
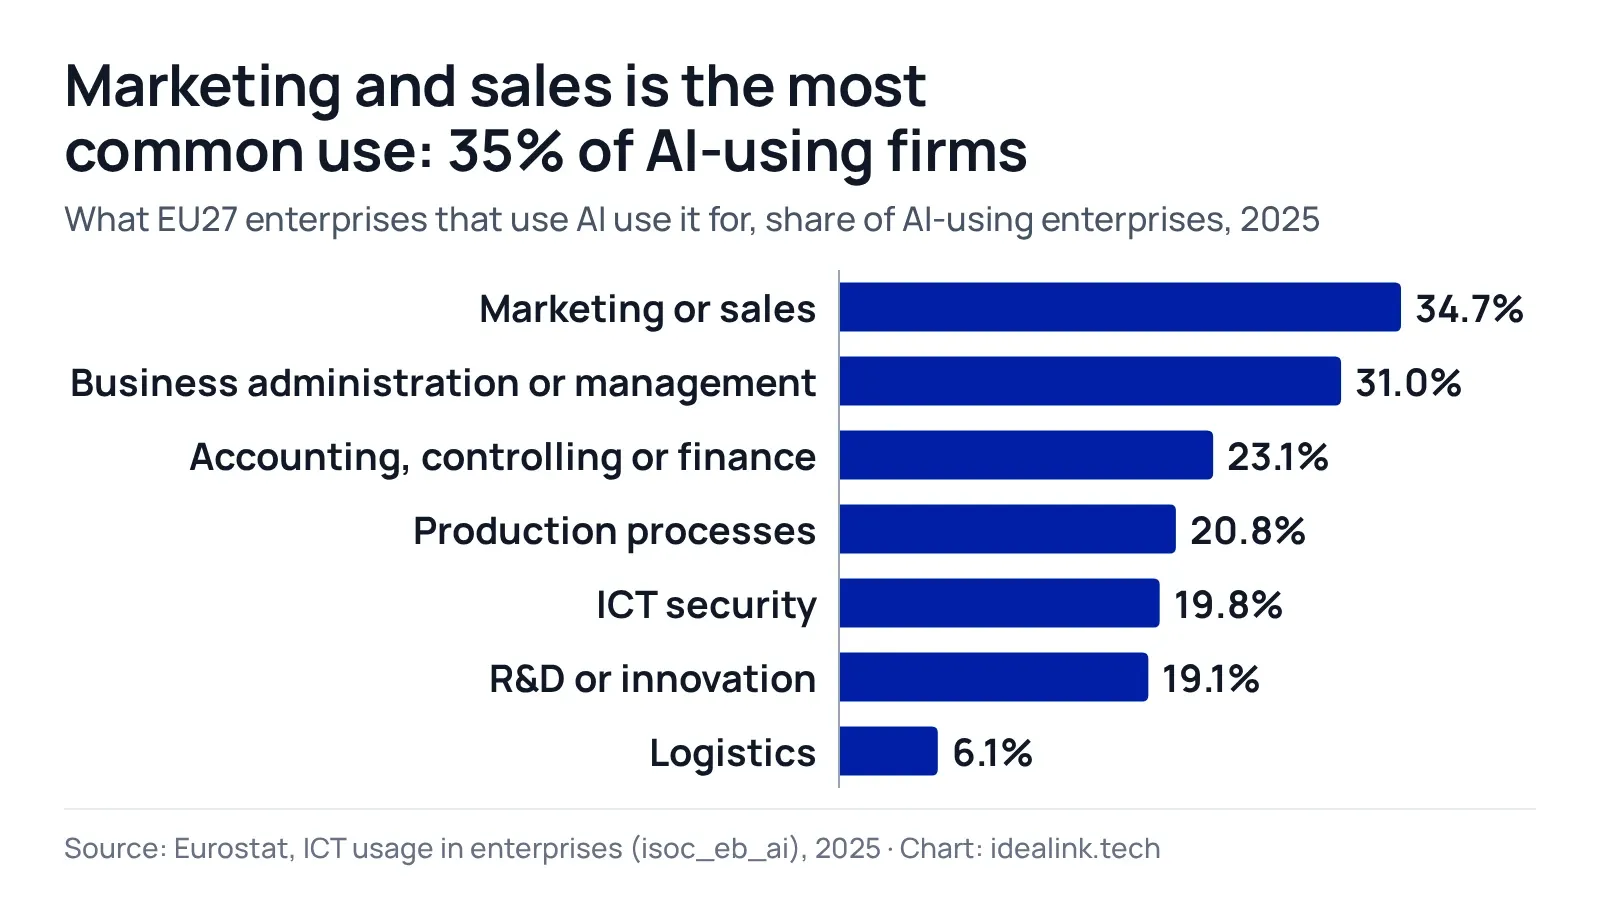
| Purpose | Share of AI-using enterprises (%) |
|---|---|
| Marketing or sales | 34.7 |
| Business administration or management | 31.0 |
| Accounting, controlling or finance | 23.1 |
| Production processes | 20.8 |
| ICT security | 19.8 |
| R&D or innovation | 19.1 |
| Logistics | 6.1 |
Source: Eurostat, ICT usage in enterprises (isoc_eb_ai), 2025. Chart and table: Idea Link.
By technology, text mining was the most widely used, at 11.8% of all enterprises. It was followed by generating pictures, video, or sound (9.5%) and generating written or spoken language or code (8.8%). These two generative technologies are the closest official statistics offer to a business rate for generative AI.
AI use at work can be measured by person or by firm. In the three months before the 2025 survey, 15.4% of people aged 16-74 in the EU used generative AI tools for work. In the US, 22.6% of employer businesses said their employees used AI for work tasks in the previous six months (Nov 2025-Feb 2026).
Vendor telemetry gives a view from the supply side. It measures usage, not businesses: 74% of Anthropic's first-party API traffic was work-related in November 2025, while 73% of consumer ChatGPT messages were not work-related in June 2025. Separately, OpenAI reported more than 7 million ChatGPT workplace seats in 2025.
How many companies use AI agents?
There’s no official statistic yet. Surveys of executives and workers put AI agent use anywhere from about a quarter to eight in ten, depending on who answered and what the survey counted as “using agents.” The statistics below spell out both.
| Survey | Who was asked | What counted as using agents | Share |
|---|---|---|---|
| KPMG AI Pulse, Q3 2026 | 314 US C-suite and business leaders at organisations with $1bn+ revenue (24 Jul-25 Aug 2026) | Building, testing, or deploying AI agents (pilots included) | 62% |
| KPMG AI Pulse, Q3 2026, multi-agent | Same | Developing or deploying multi-agent systems | 25% |
| Deloitte State of AI in the Enterprise | 3,235 director-to-C-suite leaders at organisations Deloitte describes as leading-edge, 24 countries (global survey, Aug-Sep 2025) | Using agentic AI at least moderately (74% expect to within two years) | 23% |
| PwC AI Agent Survey | US executives (Apr 2025) | Said agents are "already being adopted" in their company, to any degree | 79% |
| BCG AI at Work 2026 | Workers in 14 markets | Said agents are integrated into workflows at their organisation | 30% |
| Microsoft Work Trend Index 2025 | Leaders in 31 markets | Company deployed AI organisation-wide (AI in general, not agents specifically) | 24% |
| OpenAI usage data | EU firms with ChatGPT Enterprise or Business accounts (telemetry, Sep 2026) | Share of ChatGPT output tokens that were agentic (Codex and ChatGPT Work); usage, not firms | 55% |
Usage data adds another angle. According to OpenAI, agents (Codex and ChatGPT Work) accounted for 55% of the text output tokens generated by EU firms in the 28 days to 30 September 2026 (excluding an unspecified "Other" category). This is OpenAI telemetry from ChatGPT Enterprise and Business accounts. It measures how much of paying business customers’ ChatGPT usage is agentic, not how many firms use AI or agents. OpenAI also sells the products measured; the figure comes after its ChatGPT Work launch in July 2026. By country, OpenAI's figures put Lithuania highest and Slovenia lowest (22%, September 2026).
Most of the spread comes down to definitions: pilots versus production, executives versus workers, large companies versus all companies. If you’re assessing what building one involves, start with the row that matches your definition of “using.”
Why don't more small businesses use AI?
For EU enterprises that considered AI and chose not to use it, the main reasons were lack of expertise and legal uncertainty, not cost (Eurostat).
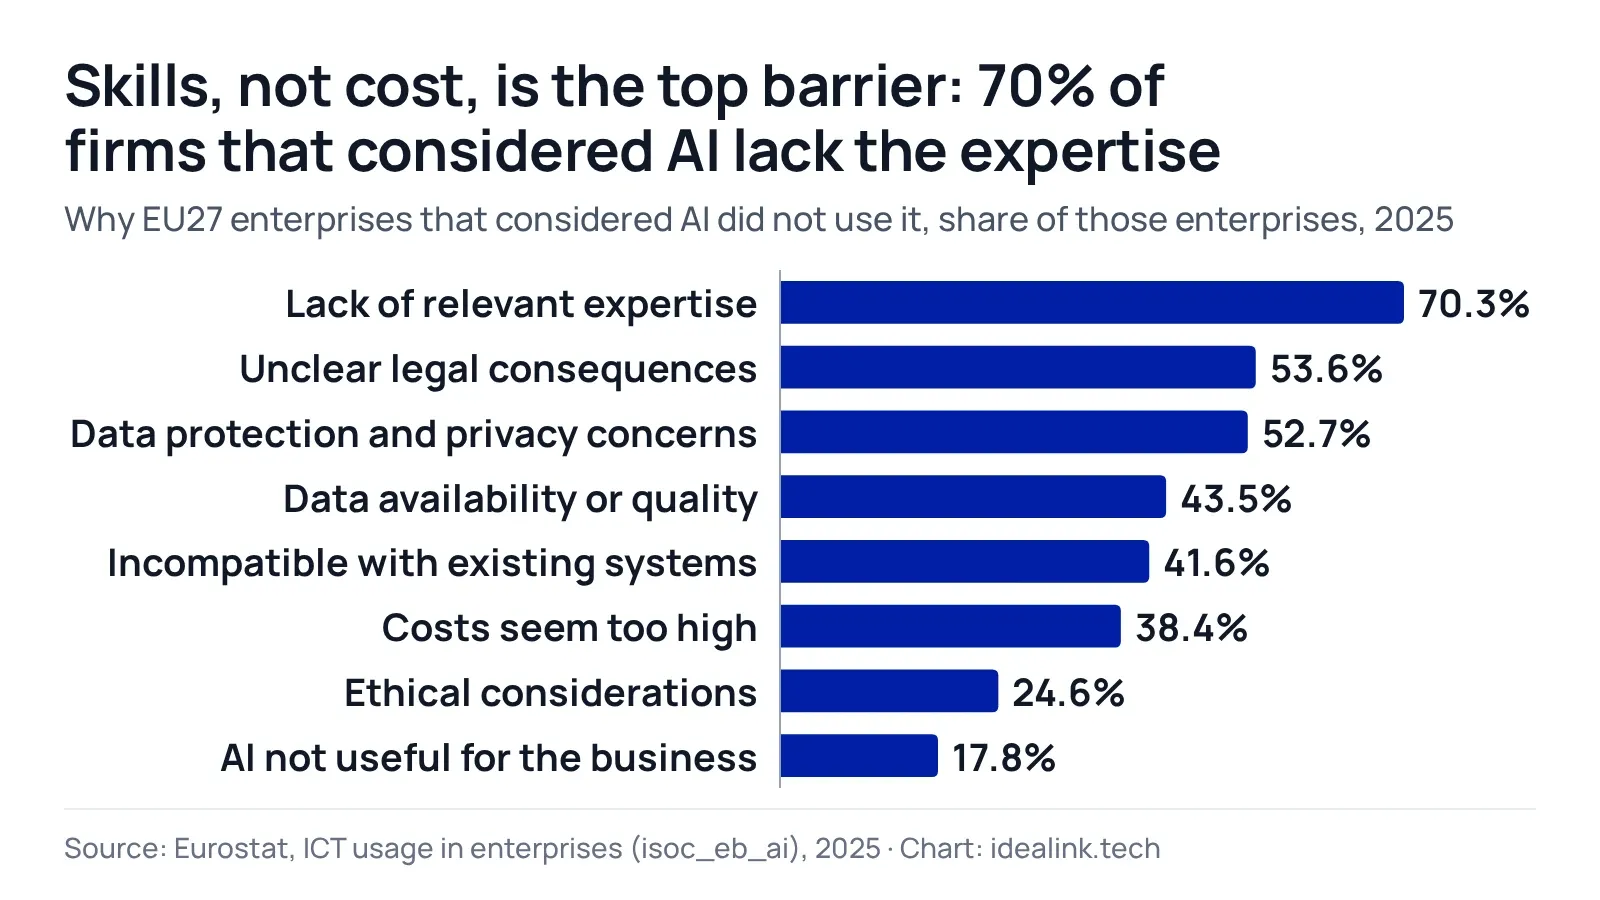
| Barrier | Share of enterprises that considered AI but did not use it (%) |
|---|---|
| Lack of relevant expertise | 70.3 |
| Unclear legal consequences | 53.6 |
| Data protection and privacy concerns | 52.7 |
| Data availability or quality | 43.5 |
| Incompatible with existing systems | 41.6 |
| Costs seem too high | 38.4 |
| Ethical considerations | 24.6 |
| AI not useful for the business | 17.8 |
Source: Eurostat, ICT usage in enterprises (isoc_eb_ai), 2025. Chart and table: Idea Link.
Among small EU firms with 10-49 employees that considered AI but didn’t use it, 71% cited a lack of relevant expertise, 55% unclear legal consequences, 52% data protection concerns, 44% data availability or quality, and 39% costs. Only a minority of small firms had considered AI in the first place. These adoption statistics describe a specific group, not all small businesses.
Other surveys put different questions to different people:
- Eurobarometer, spring 2026 (heads of EU SMEs and mid-caps, all respondents): high investment costs (50%), legal uncertainty (49%), and lack of expertise (48%) were the main barriers.
- US Census, Nov 2025-Feb 2026: among firms not planning to use AI, 65% said AI wasn’t applicable to their business.
- UK ONS, September 2026: 71% of businesses didn’t plan to adopt any AI technology in the next three months.
- France, INSEE 2025: among enterprises not using AI, 71% said they saw no use for it and 54% cited a lack of expertise.
- US Federal Reserve small business survey, autumn 2025: 46% of small employer firms used AI, but only 7% of those had fully integrated it.
Across most of these surveys, the main hurdle is knowing where AI fits, not paying for it. The Eurobarometer survey of SME heads is the exception, with cost in first place. A short AI readiness assessment can help identify which of these barriers applies to your business.
Does AI adoption pay off?
For specific tasks in controlled studies, yes. At the firm and economy level, measured effects remain small. Corporate investment keeps growing: global corporate investment in AI reached $581.69 billion in 2025, up 129.9% from 2024, according to the Stanford AI Index.
| Study | Setting | Result |
|---|---|---|
| Brynjolfsson, Li and Raymond (QJE) | Customer-support agents at one Fortune 500 software firm, staggered roll-out of an AI assistant | 15% more issues resolved per hour, with the largest gains for less experienced agents |
| Noy and Zhang (Science, 2023) | Preregistered online experiment, college-educated professionals on writing tasks | 40% less time, 18% higher quality |
| Dell'Acqua et al. (Organization Science) | 758 BCG consultants using GPT-4 on 18 realistic consulting tasks inside AI's frontier, plus one task outside it | 25.1% faster on tasks inside AI's capability frontier; 19 percentage points less likely to get a correct answer on a task outside it |
| Peng et al. (arXiv) | Upwork developers on one task (an HTTP server in JavaScript) | 55.8% faster, one task only |
| Humlum and Vestergaard (BFI/NBER) | 25,000 Danish workers in 11 AI-exposed occupations | No measurable effect on earnings or recorded hours (effects above 1% ruled out); 2.8% of work time saved on average |
| St. Louis Fed (Bick, Blandin, Deming) | US workers, nationally representative survey, Nov 2024 | 5.4% of work hours saved by users of generative AI (1.4% across all workers) |
Companies report better results, though those results are self-reported. Among US small employer firms using AI, 71% said it raised productivity, 39% improved quality, and 31% increased sales. BCG’s 2025 study found 5% of companies achieving AI value at scale and 60% reporting no material value. Its 2026 Applied AI Index, a self-assessment survey with different segments, found 7.5% of companies “future-built” and a further 41% scaling.
The employment statistics are less dramatic. Census Bureau researchers found that 95.7% of AI-using firms reported no AI-driven change in employment over six months, 2.3% reported an increase, and 2.0% a decrease. ONS reports around half of UK businesses using AI saw no change in headcount, while reductions were most common among medium-sized firms (just under 7%). In a US Chamber of Commerce survey, 47% of small businesses said AI was creating jobs and 6% said it was letting them reduce headcount. Those figures are self-reported. PwC found job postings requiring AI skills grew 69%, against 9% for all jobs. The IMF estimates almost 40% of global employment is exposed to AI. Exposure is not the same as adoption or job loss.
Idea Link analysis of Eurostat data
The gap between large and small firms is the widest difference in Eurostat’s data. We calculated it for each country using Eurostat’s isoc_eb_ai dataset (enterprises with 10+ employees, excluding finance).
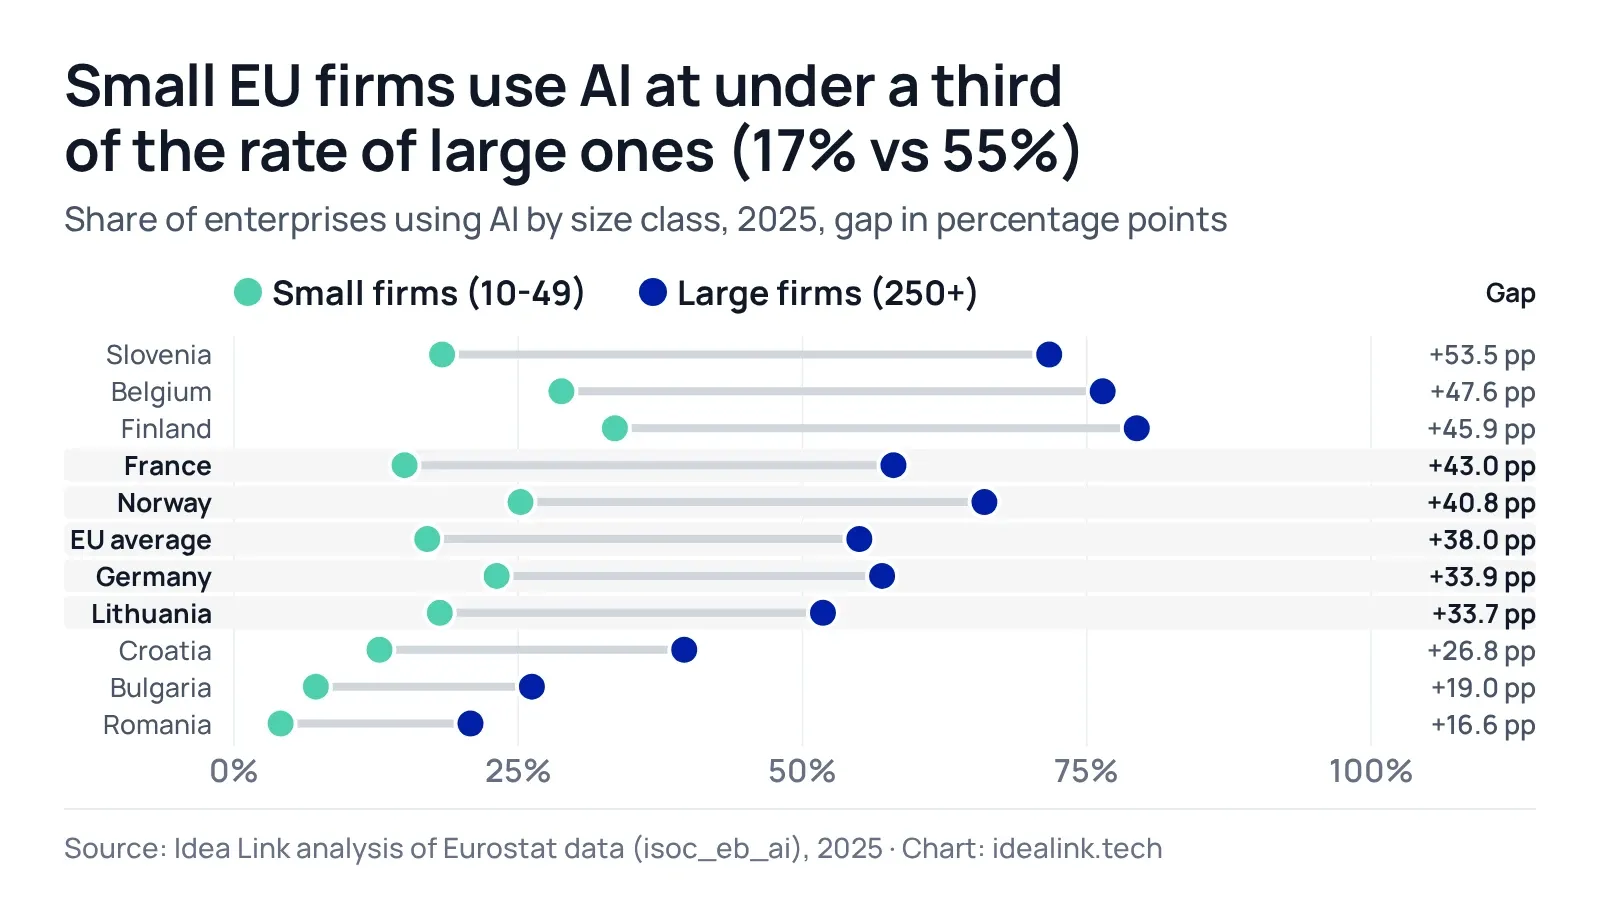
| Country | Small firms, 10-49 (%) | Large firms, 250+ (%) | Gap (pp) |
|---|---|---|---|
| Slovenia | 18.3 | 71.7 | 53.5 |
| Belgium | 28.8 | 76.4 | 47.6 |
| Finland | 33.5 | 79.4 | 45.9 |
| France | 15.0 | 58.0 | 43.0 |
| Norway | 25.2 | 66.0 | 40.8 |
| EU average | 17.0 | 55.0 | 38.0 |
| Germany | 23.1 | 57.0 | 33.9 |
| Lithuania | 18.1 | 51.8 | 33.7 |
| Croatia | 12.8 | 39.6 | 26.8 |
| Bulgaria | 7.2 | 26.2 | 19.0 |
| Romania | 4.1 | 20.8 | 16.6 |
Source: Idea Link analysis of Eurostat, ICT usage in enterprises (isoc_eb_ai), 2025, selected countries; gaps are computed from unrounded values, so they can differ by 0.1 from the rounded columns. Chart and table: Idea Link.
- Size gap (Idea Link analysis of Eurostat data). Small EU firms used AI at 30.9% of the rate of large firms: 17.0% against 55.0%, a difference of 38.0 percentage points. Method: subtract the share of small enterprises using AI from the share of large enterprises, country by country.
- Widening gap (Idea Link analysis of Eurostat data). From 2023 to 2025, small firms had the fastest relative growth (x2.7), but the gap with large firms still widened from 24.1 points to its 2025 level. Medium firms grew x2.3 and large firms x1.8. Method: divide each size class’s 2025 share by its 2023 share, then compare the large-minus-small difference in both years. The 2025 survey added one technology type for generating pictures, video, or sound and widened the definition of another, generating written or spoken language, to include programming code, so part of the change comes from the definition. Small firms’ rate rose from 21.0% to 30.9% of large firms’ rate.
- Growth ranking (Idea Link analysis of Eurostat data). Denmark added the most (+14.5 points), Finland came second (+13.5), and Lithuania third (+12.5). Greece was the only country where AI use fell (-0.9 points). Method: subtract each country’s 2024 share from its 2025 share, then rank 28 countries. The 2025 survey added a technology type, so part of the growth in every country is definitional.
- Focus countries against the EU average (Idea Link analysis of Eurostat data). Method: subtract the EU27 average from each country’s 2025 share, then rank by level and by 2024 to 2025 growth.
| Country | 2025 (%) | Against EU average (pp) | Level rank (of 28) | Growth (pp) | Growth rank (of 28) |
|---|---|---|---|---|---|
| Lithuania | 21.3 | +1.4 | 13 | +12.5 | 3 |
| Norway | 28.9 | +8.9 | 8 | +8.1 | 13 |
| France | 18.2 | -1.8 | 16 | +8.3 | 11 |
| Germany | 26.0 | +6.0 | 9 | +6.2 | 16 |
Every figure can be recalculated from Eurostat’s public isoc_eb_ai data using the method listed beside it.
Popular AI stats we couldn't verify
These figures turn up often. Where a source is available, it supports a narrower, older, or different claim.
| The claim | What the source actually says | Verdict |
|---|---|---|
| 77% of companies are using or exploring AI | IBM's 2022 poll of 7,502 senior business decision-makers found 35% using AI and 42% exploring it. The 77% adds the two. | Outdated |
| 78% (or 88%) of companies use AI | Stanford's AI Index charts McKinsey survey respondents saying their organisation uses AI in at least one business function: 88% in 2025, 78% in 2024. These are survey respondents, mostly at larger organisations, and the AI Index calls them directional. | Misquoted (respondents, not companies) |
| US business AI use jumped from 3.7% to 25% | Two different questions. The old wording ran from 3.7% to 10.0%. The new wording started at 17.3% in November 2025 and reached 24.6%. | Misquoted (question changed) |
| The EU average is 48% and Germany 64% | No source found. Eurostat's 2025 data has 20.0% for the EU and 26.0% for Germany. | Untraceable |
| The EU wants 75% of companies to use AI by 2030 | Decision (EU) 2022/2481 sets a target of 75% of enterprises taking up cloud computing, big data, or AI. The Commission also tracks AI alone against 75%. | Misquoted (either/or target) |
| MIT says 95% of generative AI pilots fail | The MIT NANDA report (a copy hosted by law firm Webber Wentzel; MIT's own link, nanda.media.mit.edu/ai_report_2025.pdf, now redirects to the project page) is labeled preliminary. It draws on a review of over 300 public AI initiatives, interviews with 52 organisations, and 153 survey responses from senior leaders at four conferences, and says its figures are directional. It is not a measured failure rate. | Narrower than claimed |
| Businesses get $3.50 back for every $1 invested in AI | A 2023 IDC survey of over 2,000 business leaders, sponsored by Microsoft. The returns are self-reported estimates. | Narrower than claimed |
| GitHub Copilot makes developers 55% more productive | One task, an HTTP server in JavaScript, 55.8% faster across 95 freelancers, with a wide confidence interval. | Narrower than claimed |
| UK AI adoption is 15% or 16% | The 15% is a 2022 estimate by DCMS and Capital Economics, often credited to ONS. The 16% is DSIT fieldwork from Feb-May 2025. ONS now reports 30% for all businesses. | Outdated |
Stale figures make their way into AI-generated answers and keep circulating after the original source has been replaced. The statistic survives. Its context doesn’t.
Methodology
We favored primary sources wherever available: official statistics, international bodies, peer-reviewed papers and working papers, and industry surveys that reported their sample and method. Each source’s own definition determines what counts as artificial intelligence. The Atlanta Fed figure comes from a Federal Reserve Board note, and the MIT report from a third-party copy. A separate reviewer checked every figure against its source on 29 October 2026. We verified 127 source figures and 7 Idea Link analysis figures (134 rows in the CSV), and dropped 5 because their source could not be opened.
Sources differ by population (10+ employees or all firms), time window (“last two weeks” or “regularly”), unit (firms, workers, or survey respondents), and weighting (by firm count or employment). The page spells out those differences rather than presenting unlike statistics as comparable.
Idea Link’s analysis uses Eurostat’s API (isoc_eb_ai, indicator E_AI_TANY, enterprises with 10+ employees) and the method stated beside each figure. Every derived figure is labeled “Idea Link analysis of Eurostat data.”
Update policy: US Census figures are refreshed with each biweekly BTOS release, Eurostat figures when the 2026 data lands (due 15 December 2026), and every figure is re-checked in full each quarter.
How to cite this page
Idea Link (2026). AI Adoption Statistics 2026. idealink.tech/blog/ai-adoption-statistics
Download the dataset (CSV). It has one row for every statistic, with its definition, period, publisher, and source URL. Please cite the original source for each number as well.
Frequently asked questions
How many companies use AI?
24.6% of US employer businesses used AI (Census Bureau, two weeks to 4 October 2026), as did 20.0% of EU enterprises with 10 or more employees (Eurostat, 2025) and 30% of UK businesses (ONS, September 2026). These official figures count different things. Surveys of executives at large firms report much higher shares.
What percentage of businesses use AI in Europe?
In 2025, 20.0% of EU enterprises with 10 or more employees used AI, up from 13.5% in 2024 (Eurostat). Part of the rise reflects a broader survey definition. Eurostat’s next release is due on 15 December 2026.
What is the AI adoption rate in the US?
In the two weeks to 4 October 2026, 24.6% of US employer businesses used AI in a business function (US Census Bureau). The question changed in November 2025, so this figure can’t be compared with the first reading under the old question, 3.7%.
Which country has the highest AI adoption?
Among EU countries, Denmark led in 2025: 42.0% of enterprises with 10 or more employees used AI, ahead of Finland and Sweden (Eurostat). Statistics Norway’s 2026 national figure of 48% isn’t comparable with Eurostat’s 2025 statistics (Statistics Norway).
Which industry uses AI the most?
Information and communication leads: 62.5% of EU enterprises in 2025 (Eurostat), 46.4% of US businesses in the Information sector (Census Bureau), and around 60% of UK businesses in that sector (ONS).
How many small businesses use AI?
In 2025, 17.0% of EU enterprises with 10-49 employees used AI (Eurostat). In the US, 24.3% of employer businesses with 1-4 employees used AI in the two weeks to 4 October 2026 (Census Bureau). In the UK, 29% of businesses with fewer than 10 employees did so in September 2026 (ONS). The size classes differ, so these three statistics aren’t directly comparable.
How many companies use AI agents?
There’s no official statistic. KPMG found 62% of US organisations with $1bn+ revenue were building, testing, or deploying AI agents, while Deloitte found 23% of leading-edge companies used agentic AI at least moderately. Much of the gap comes down to whether pilots count.
For a growing company that has outgrown its spreadsheets and tools, these statistics often point back to expertise. AI also means the system replacing those tools can be built faster than before. Idea Link starts that work with a fixed-price Design & Architecture Sprint, where we map how the business runs and design the system before anything is built.